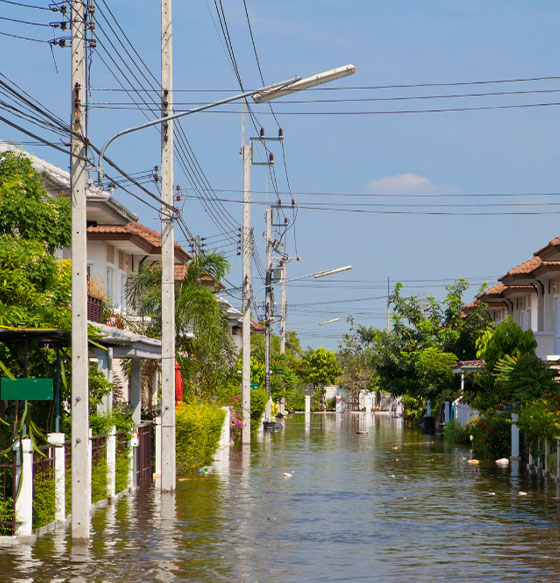
In the age of climate change, most communities are making plans towards resiliency. As these plans are developed, it is important to consider the tradeoffs needed to preserve the health of the community while still allowing for growth. We often hear about changing property values and the positive economic growth that new development—and redevelopment—can bring to a community. However, the goods and services that natural ecosystems provide, such as timber production, clean water, flood protection, and biodiversity support, are often left out of this conversation. The services provided by untouched ecosystems often compete with property values and expanding development. Ignoring ecosystem services when making planning decisions could lead to the potential loss of important tools that could be used for climate mitigation and adaptation, making the goal of resilience even harder for a community to achieve. On the flip side, creating and restoring natural systems can help provide a first line of defense against flooding impacts.

In order to effectively plan for resilience, communities need to be able to visualize the value of the services their ecosystems provide in context with both appraised property values and the risks posed by climate change.
Incorporating ecosystem services into the StormSensor® SURFR™ Index could assist communities in making wiser management decisions optimizing existing natural systems to mitigate the risks posed by climate change. The results of these efforts may also inspire communities to restore ecosystems, such as coastal wetlands, to further mitigate climate risk.
One of the main areas StormSensor® has worked to help communities become more resilient is in helping them to better evaluate their flood risk at a relatively high resolution. StormSensor® has developed a Stormwater Urban Flood Risk (SURFR™) Index that combines environmental, geographic, and social risk factors to assign flood risk scores across a community.
As a case study, we built on the SURFR™ Index by exploring property parcels in Maple Valley, WA, to evaluate how appraised property value compares to ecosystem service value for each parcel, and how that links back to the flood risk identified by SURFR™. We present a decision model that communities can use to consider all of these factors when making decisions focused on long-term climate resiliency.
Findings of this case study indicate that estimating ecosystem services for a community provides valuable information that can be used to make strategic decisions to address flood risk.
SURFR™ scores are calculated for a city’s geographic sub-regions called Risk Management Zones (RMZs), which, for this case study, are census tracts. The SURFR™ Index is based on nine factors that can affect urban flood risk. The final index ranges from 0 (lowest risk) to 100 (highest risk).
In Maple Valley, a total of eight census tracts were evaluated using the SURFR™ index and three were ranked as highest risk. Elevation, impervious surfaces, and a low slope were the factors that most contributed to the flood risk in these three RMZs.
Once a community prioritizes high flood risk areas, they can look at individual property parcels within these areas to make specific planning decisions. Each land parcel has an appraised land value, as well as a calculated ecosystem service value, and can be grouped into a property type category. For Maple Valley, we examined 8,871 property parcels grouped into five property types.

We identified two dominant property types in Maple Valley: Residential and Vacant, which covered 70% of the area and had important implications for how appraised land value and ecosystem service value could be used to manage flood risk.
Residential properties were small, numerous, and had the highest appraised property value per acre. The average appraised value of residential properties was $890,000/acre and the average ecosystem value only $125/acre. Almost all residential properties had a $0/acre ecosystem value. The ecosystem service value for residential properties was low because they have very little natural land cover. The high appraised value and low ecosystem value of residential properties make them vulnerable to high economic losses as a result of climate impacts.
Vacant properties had a high ecosystem value per acre because, even though they are held for commercial, industrial, and residential uses, they remain largely undeveloped and had high levels of natural land cover. Vacant properties have the potential to serve as tools for adaptation to climate change.


The SURFR™ Index identifies areas within a city that are at high risk of flooding and empowers communities to prioritize flood risk levels across their community so they can make informed decisions about where and how to focus efforts to address flooding.
Adding a property and ecosystem service assessment to SURFR™ can help communities like Maple Valley develop smarter, more strategic climate preparedness plans to generate positive economic, ecological, and social impacts over the long term.

Communities can prioritize flood risk areas while identifying areas of ecological resources that could be leveraged to manage that risk. For example, in areas where flood risk is high and ecosystem services are low, residential and commercial properties are likely at high risk for economic losses. These areas should be prioritized for increasing ecosystem services by investing in blue-green infrastructure like green roofs, blue roofs, stormwater pools, permeable parking lots, and rain gardens. Conversely, in areas where flood risk is high and ecosystem service values are high, ecological resources already exist to mitigate some effects of climate change. Active conservation of ecosystems should be prioritized to continue providing valuable services in the long term. Additionally, where land parcels permit (such as vacant lots), restoration of large-scale green spaces like wetlands and green corridors can maximize ecosystem value.

Costanza, R., De Groot, R., Sutton, P., Van der Ploeg, S., Anderson, S. J., Kubiszewski, I., Farber, S., Turner, R. K. (2014). Changes in the global value of ecosystem services. Global Environmental Change, 26: 152-158.
Foundation for Sustainable Development (2021). Ecosystem Services Valuation Database 1.0. [Accessed December 8, 2021] https://esvd.net